Incident prevention platform (IPP) is a in-house monitoring and chaos engineering platform for our services.
It provides a UI portal to help user set up a daemon in their EC2 instances to collect logs and metrics.
It provides built-in dashboards to monitor EC2 resources, HTTP requests (Apdex) and AWS resources.
It provides chaos engineering functionality including CPU pressure, Memory pressure, Disk pressure and network connectivity blockade.
In this project, I contributed to those items
Introduced Terraform to the team and used it to deploy AWS infrastructure including Step Function, VPC Endpoint Service, Lambda, S3 Bucket, IAM Role.
Developed Step Function to help new customer to integrate with our platform. This Step Function created VPC Endpoint in customer AWS account and use SSM run command to set up Telegraf agent.
Developed backend service with Golang and gRPC.
Developed Lambda functions to aggregate data and interact with API by using gRPC.
The aggregated data includes Apdex, P99, P50 to better monitor service performance.
Developed Grafana dashboard templating engine. Our backend service can create certain dashboards for customers based on their requirements.
Developed frontend with React. Users can execute a chaos engineering task by using UI.
Used TestCafe to write frontend E2E testing.
Implemented CI/CD in GitLab Pipeline.
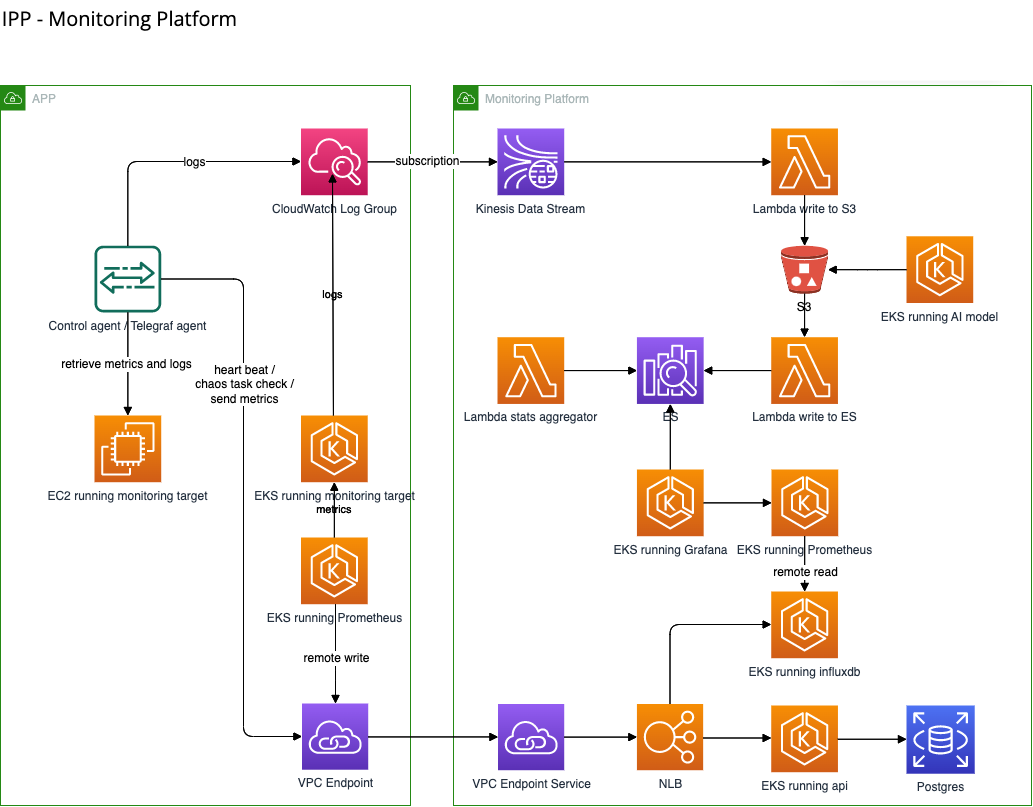
Architecture
Logs and Metrics
Used InfluxDB, Prometheus and CloudWatch Metrics to store service metrics.
Used Elasticsearch, S3 and Kinesis to store service logs.
Chaos Engineering
Used tc and stress to simulate packet lost, high network latency, CPU pressure and Memory Pressure … etc.
EKS Monitoring solution
Used Prometheus Operator to monitor services. Also, we used Prometheus Remote Write / Read to collect customer’s metrics into our Prometheus. Then we used Prometheus Federation to aggregate data and provided user metrics from our aggregated Prometheus.