
FinTech - How to monitor API error rate?
High level of the API traffic
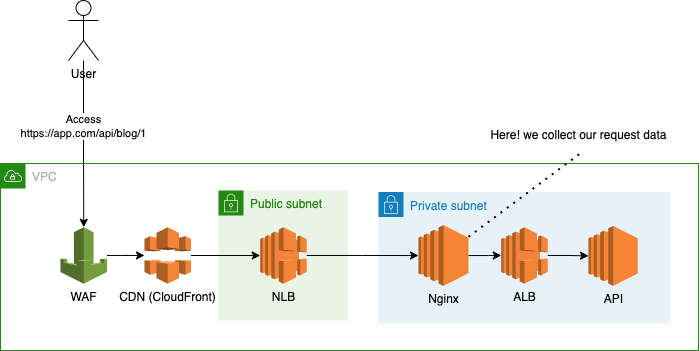
This diagram shows the route of one API request. We can collect request information at the “Nginx” stage, and the information has response time and status code.
What happen inside the Nginx?
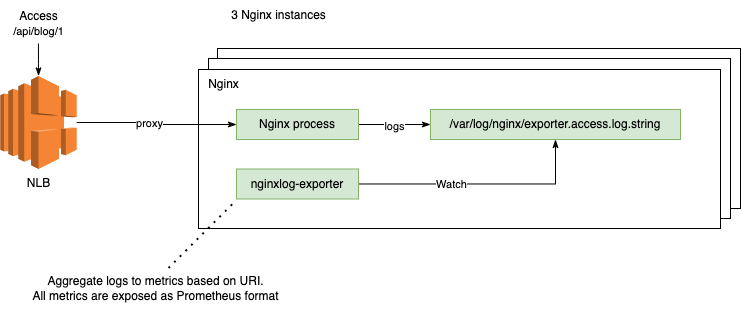
The Nginx instance has two process : Nginx and nginxlog-exporter.
Nginx will write the request information to log file, and then nginxlog-exporter watch that log file to aggregate the information based on URI.
Here is an example of exporter.access.log.string log file
app.com /api/blog/1 GET 200 0.002
app.com /api/blog/2 GET 200 0.008
app.com /api/blog/3 GET 200 0.027
app.com /api/user/1 GET 200 0.003
app.com /api/user/2 GET 404 0.003
These log can tell us some informations:
- How long the request takes?
- Is this request succeed with status code 200?
Logs format:
${domain} ${uri} ${http_method} ${http_status_code} ${request_time}
Finally, we need to transform the logs to metrics in order to monitor it.
nginxlog-exporter helps us to archive this! We just give it a config file like below.
namespaces:
  - name: dispatcher_nginx
    format: "$domain $uri $http_method $http_status_code $request_time"
    source_files:
      - /var/log/nginx/exporter.access.log.string
    ...
    aggregrateuri:
      # blog related api
      - /api/blog/
      # user related api
      - /api/user/
      # others api
      - /
Access the metrics that nginxlog-exporter provided.
We can know information:
- GET app.com for
/api/blog/*has been succeed for 55,984 times.
curl "0.0.0.0:4040/metrics"

dispatcher_nginx_http_response_count_total{app="nginx",environment="prod",host="api.com",method="GET",status="200",uri="/api/blog"} 55984
Finally, How to collect these metrics and evaluate it?
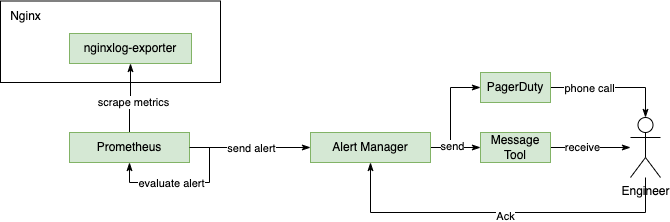
nginxlog-exporter expose metrics as Prometheus format, therefore, we use Prometheus to scrape it. Done! Now we have all the metrics in the time series database (Prometheus) 🎉
We can add alert rule base on the requirement, for example an alert for 4xx error rate :
- alert: "path /api/blog/ 4xx error rate exceed 1%"
  expr: sum(increase(dispatcher_nginx_http_response_count_total{uri="/api/blog", status=~"4.."}[1m])) / sum(increase(dispatcher_nginx_http_response_count_total{uri="/api/blog"}[1m])) > 0.01
  for: 1m
  labels:
    severity: warning
    app: api
  annotations:
    description: "Nginx blog related api (path /api/blog) 4xx error rate exceed 1%"
This alert rule use expr to know how to evaluate the metrics with PromQL syntax.
Because the metrics we got dispatcher_nginx_http_response_count_total is an incremental integer, we need to use increase to find the different between two data points.
Since we want to get 4xx error rate > 1% alert here, we use increase(4xx)/increase(all)>0.01 ✨
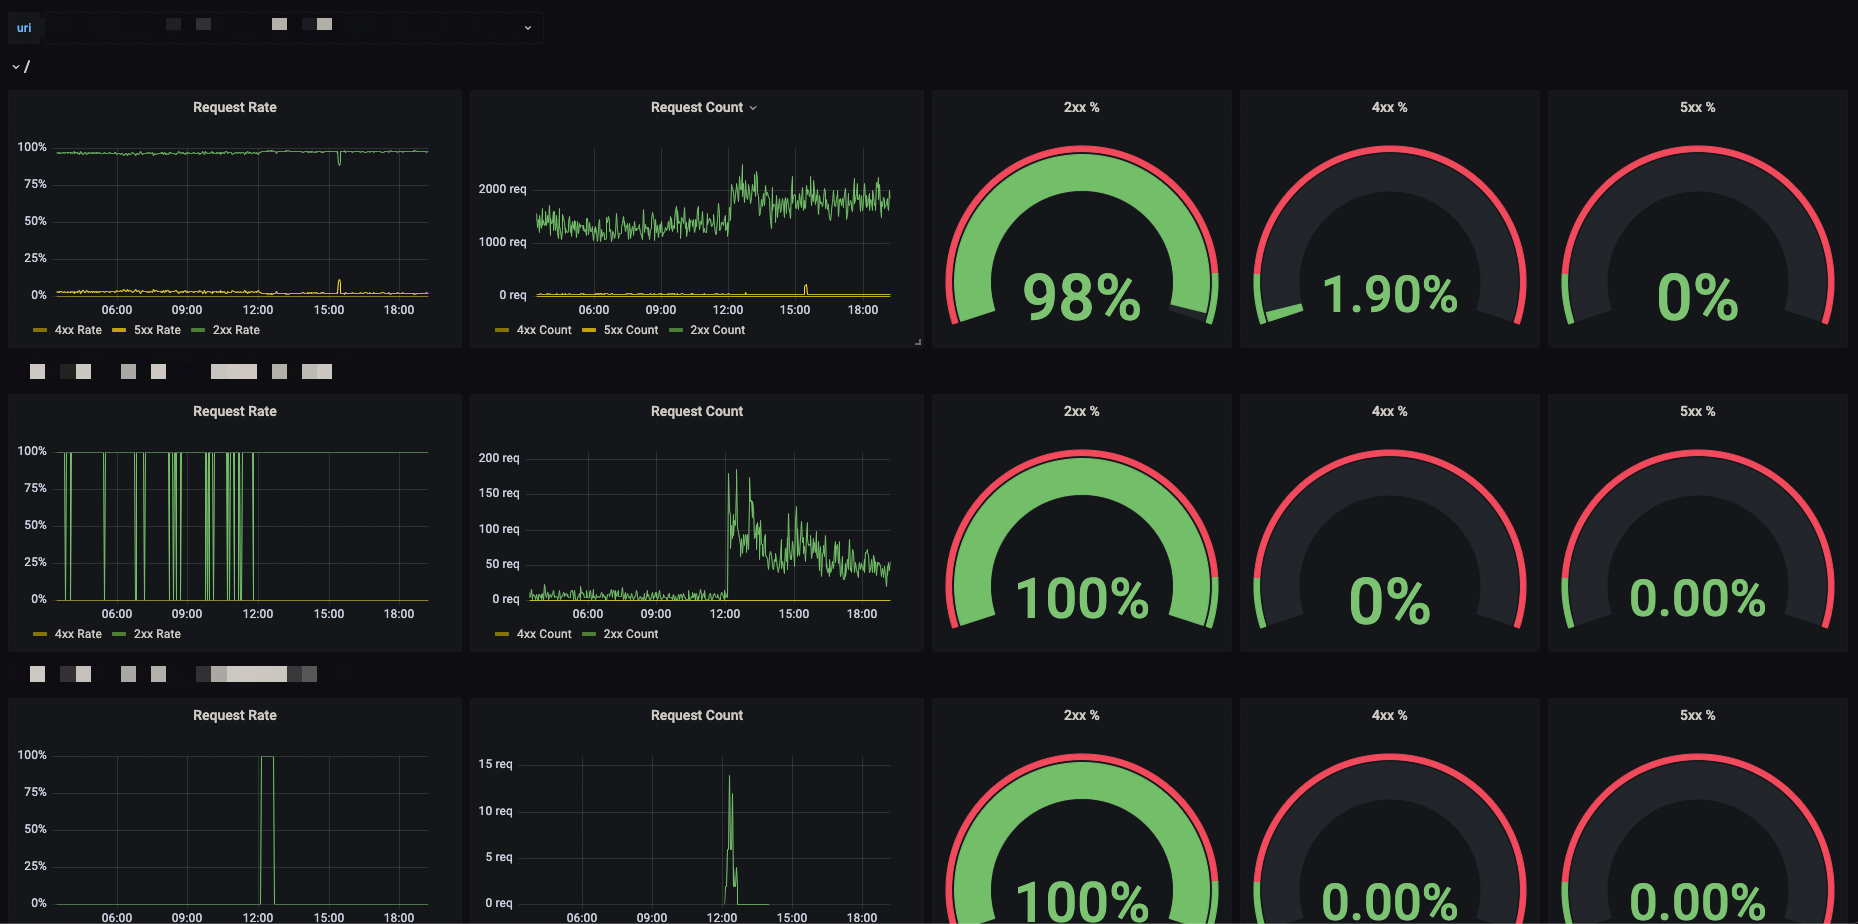
Also, we can use Grafana to create some dashboards.
The End.
Future Plan?
nginxlog-exporter can also aggregate the response time of request. If we want to monitor P99, P90 latency, we can try it!