
E-commerce Platform - Data Pipelines with Debezium and monitoring
What are these Data Pipelines
- The analysis tasks of e-commerce platform rely on a Postgres database. We have a data pipeline to sync our data from MongoDB and MySQL to Postgres.
- The data pipeline of MongoDB to Postgres was achieved by Change Streams
- The data pipeline of MySQL to Postgres was achieved by Debezium
Why we did this
- We need to ensure these data pipelines are in-sync and functional.
- We need to build a CDC solution to stream MySQL changes to Postgres.
In this project, I contributed to those items
-
Used Nodejs to implement a custom Prometheus Exporter to collect the latest timestamp of specific MongoDB Collection and get the latest timestamp of record we wrote to Postgres.
-
Used Prometheus and Grafana to build a dashboard and alerts for the data pipeline. Once the data in the Postgres behind MongoDB for more than 5 minutes, it sends out an alert.
-
Deployed Debezium in EKS to fulfill MySQL CDC requirement.
-
Developed a custom Helm Chart to help us add Service Monitor more easily.
{{- range $serviceMonitorName, $ref := .Values.serviceMonitors }}
apiVersion: monitoring.coreos.com/v1
kind: ServiceMonitor
metadata:
  name: {{ $serviceMonitorName }}
  labels:
    release: prometheus-operator
  {{- if hasKey $ref "labels" }}
    {{- range $key, $value := $ref.labels }}
    {{ $key }}: {{ $value | quote }}
    {{- end }}
  {{- end }}
spec:
  namespaceSelector:
    matchNames:
    {{- range $namespace := $ref.namespaceSelector }}
      - {{ $namespace }}
    {{- end }}
  selector:
    matchLabels:
      {{- range $key, $value := $ref.selector.matchLabels }}
      {{ $key }}: {{ $value | quote }}
      {{- end }}
  endpoints: {{- toYaml $ref.endpoints | nindent 4 }}
{{- end}}
Architecture
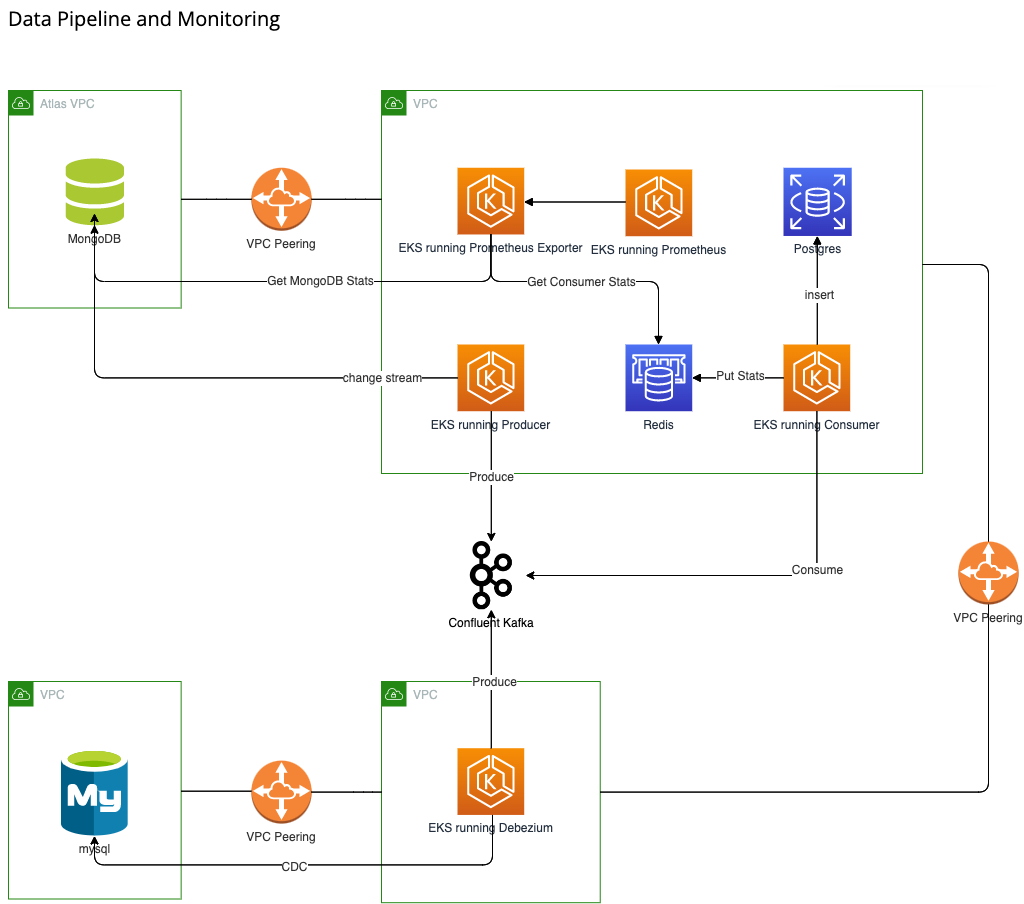
The high level view of this solution.
Result
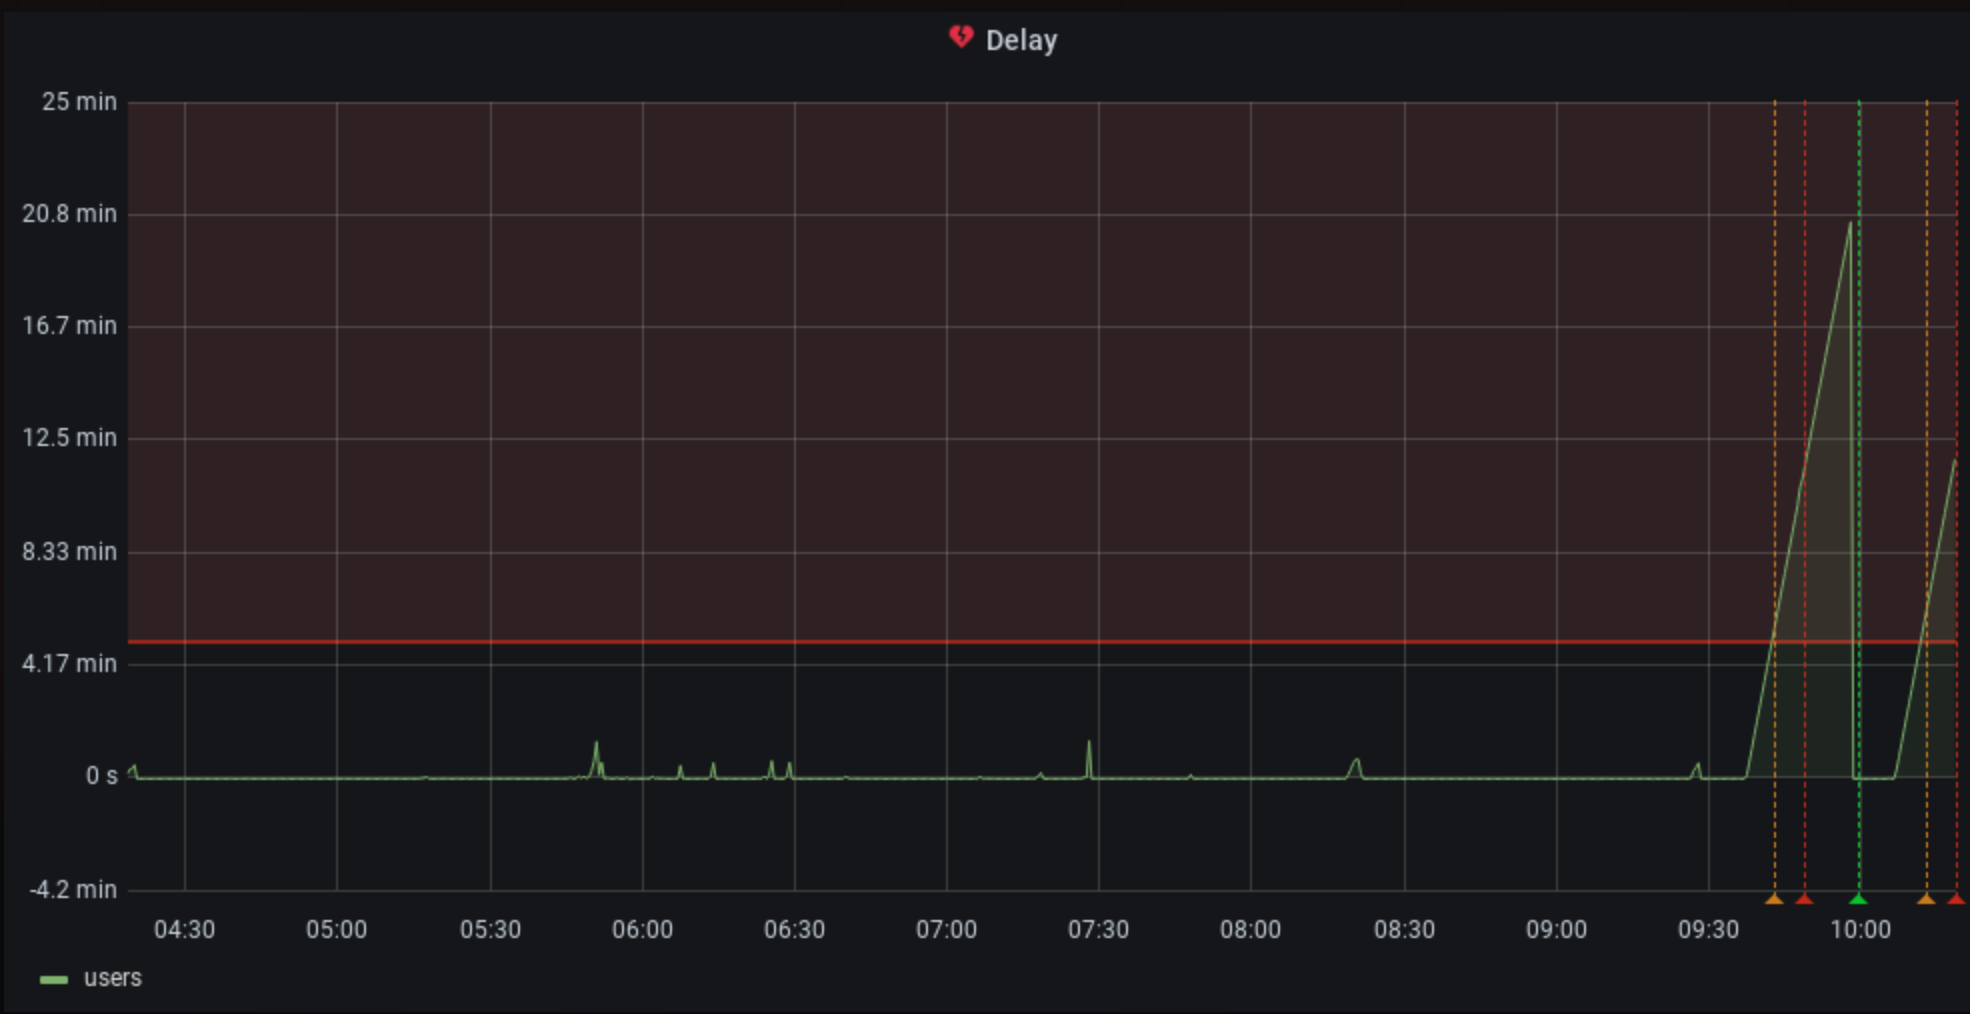
We can monitor the delay of data pipeline with near real-time.